FULL ICT TRADING COURSE – ICT Basics: A Beginners Guide through to Advanced
$999.99 Original price was: $999.99.$299.99Current price is: $299.99.
One of the most popular trading philosophies out there today is the ICT methodology. Short for Inner Circle Trader, and utilized by many in The Strat community, this style of trading is purely based on price action and incorporates little to no use of trend following or momentum indicators. In this article, we’ll go over the basic concepts of the ICT methodology so that you can begin to understand how to utilize it in your trading! Let’s jump in.
Key ICT Concepts
The ICT trading methodology consists of some key concepts that every trader must know in order to take advantage of trading in this style. In the sections below, we’ll discuss the key takeaways as well as show how to utilize some of these concepts within the bestmt4ea platform.
Liquidity
Liquidity is the first, and arguably the most important concept within the ICT trading methodology. There are two types of liquidity; Buy-side and sell-side. Buy-side liquidity represents a level on the chart where short sellers will have their stops positioned. Sell-side liquidity is just the opposite. It represents a level on the chart where long-biased traders will place their stops. In both cases, these levels are often found at or near extremes as the tops and bottoms of ranges are often viewed as areas where traders are ‘proven wrong’ and, therefore, will want to get out of their trades.

‘Smart money’ players understand the nature of this concept and commonly will accumulate or distribute positions near levels where many stops reside. It is, in part, the sheer amount of stops at key levels that allow a larger player to fully realize their position. Once the level at which many stops are placed has been traded through, it’s often that the price will reverse course and head in the opposite direction, seeking liquidity at the opposite extreme.
Displacement
Displacement, in short, is a very powerful move in price action resulting in strong selling or buying pressure. Generally speaking, displacement will appear as a single or a group of candles that are all positioned in the same direction. These candles typically have large real bodies and very short wicks, suggesting very little disagreement between buyers and sellers.

Often, a displacement will occur just after a liquidity level has been breached, and will often result in the creation of both a Fair Value Gap and a Market Structure Shift.
Market Structure Shift
As many traders know, the basics of trend say that in an uptrend, the price is making higher highs and higher lows and in a downtrend, the price is making lower highs and lower lows. A market structure shift is represented by a level on the chart where the previous trend is broken. If the price is in an uptrend, the market structure shift level is where a lower low is made. If the price is in a downtrend, the market structure shift level is generally going to be at a point where a higher high is made. In both cases, market structure shifts tend to occur on the heels of a displacement.

Once the price has traded through a market structure shift level, a savvy trader will look begin to look for further signs that the trend has, in fact, changed, using the market structure shift level as a level to trade off of.
Inducement
Rarely does price move in a straight line. Within a larger trend, there are almost always counter-trend moves. These counter-trend moves are the results of lower time frame liquidity hunting. The price will bounce or get rejected and then will target a previous short-term high or low before continuing in the same direction as the longer-term trend. Inducement is specifically the targeting of these short-term highs or lows as areas where stops might be placed.

As we know, liquidity lies where an influx of stops are located, and once those stops are taken out, the price can continue in the direction it was previously going. For traders who are used to utilizing chart patterns, Inducement can be seen in the formation of bull and bear flags.
Fair Value Gap
After the price reaches a liquidity level and then reverses, often what will come next is Displacement. Fair Value Gaps are created within this displacement and are defined as instances in which there are inefficiencies, or imbalances, in the market. These imbalances are visualized on the chart by a three-candle sequence containing one large middle candle whose bordering candles’ upper and lower wicks do not overlap.

Many traders are interested in Fair Value Gaps because they can become magnets for price in future price action.
Optimal Trade Entry
Optimal Trade Entries are just that; They represent the best places to get into a trade and they can be identified by utilizing the Fibonacci drawing tool. In most cases, an optimal trade entry will lie somewhere between the 61.8% and 78.6% retracement of an expansion range.

After a Market Structure Shift occurs and a new leg of price action is formed, the bounce that follows the new leg will often yield an opportunity to take a position in the direction of the new leg and these Fibonacci retracement levels can be used to identify where that position should be taken.
Balanced Price Range
A Balanced Price Range is the result of an aggressive move up that’s immediately followed by an aggressive move down or an aggressive move down that’s immediately followed by an aggressive move up. What’s left after either of these instances is essentially a double Fair Value Gap which can act as a magnet to the price before a continuation move higher or lower.

Balanced Price Ranges can sometimes signal the beginning of a Market Structure Shift, and the price can often retest and reject from these areas.
You’ve made it so far! Now put your knowledge to use!
How To Utilize ICT Concepts In bestmt4ea
Fair Value Gap Indicator
Bestmt4ea offers auto-discovery of Fair Value Gaps for all of it’s users via the ‘Fair Value Gap’ indicator. In order to access it, click on the three dots next to the ‘Indicators’ button in the top toolbar.
The ‘Gap Factor’ value will determine the size of the Fair Value Gap and it is preset to a value of ‘1’. In order for the indicator to highlight smaller Fair Value Gaps, simply utilize a decimal value. In the image below, a Gap Factor of .25 was used to achieve greater granularity and discover smaller Fair Value Gaps that exist on the chart. A common practice amongst users is to utilize the horizontal line drawing tool and set alerts at important Fair Value Gap levels.

Fractal Trendlines
The Fractal Trendlines indicator has many uses, but one of the best ways to implement it is via the scanner.
Within the scanner, bestmt4ea users can utilize the shared ‘Broadening Range’ scanners to find instances where the price is trading near the top or bottom of the range. Traders hunting for tickers whose price is near a Liquidity level might find this functionality particularly helpful!
Auto Fibonacci Drawing Tool
Determining where and how to draw a Fibonacci sequence can be tricky, which is why one of the most popular ‘Auto-analysis’ tools on the bestmt4ea platform is the Auto-Fib drawing tool. To utilize this tool, simply click on the ‘Auto Fib’ button in your top toolbar and a Fibonacci sequence will be drawn on the most recently completed move per the time frame selected.
In order to get the most up-to-date measurement, do be sure to click the refresh button in the top left corner of your chart view. By clicking refresh, all auto-analysis tools will be updated to include the most current candle.
100% AUTOMATED ROBOT, 95% ACCURATE, HANDS-FREE TRADING WORKS ON MT4.
FOREX ROBOTS. TOTAL EXPERT ADVISOR COLLECTION – TESTED WITH OVER $1,000,000 PROFIT.
BEST MT4 EA is a very short scalper EA that analyzes the market by using some of the most powerful indicators, it uses the main trend to enter the market. This EA uses the D1 timeframe for identifying the trend and uses a short timeframe to enter the market. It is a scalper with a very short take and a stop.
It’s a unique EA that actually works and has proven results! 93% Winning percentage with proper money management. It uses an adaptive trade trailing algorithm. This EA always uses SL, so the account is mostly protected from big-equity drawdown. BEST MT4 EA doesn’t use any dangerous strategies like martingale.
This EA was backtested with many months of data and successfully passed multiple stress testing and passes every month with a very advantageous profit/drawdown ratio.
SPECIAL FEATURES
DR/IDR + ICT CONCEPTS 88% PROBABILITY STRATEGY – TRADE WITH THE ALGO’S AND BE ON THE WINNING SIDE
Number One Robot for Forex & Crypto Trading.
Based on Price Action and Trend Analysis with Artificial Intelligence.
Works Best with EURUSD, XAUUSD, GBPUSD, BTCUSD, BTCJPY.
You can use this EA on Multiple Accounts with Life Time Premium Support.
MyFXbook, FxBlue & Live Trading Verified.
Monthly Expected Profit is 25% to 200% with 10-20% Drawdown.
ACCOUNT DETAILS
Minimum account balance of 100$.
Work Best on any pair. (Best on EURUSD mainly because of the low spread)
Work Best on M5 and M15 TimeFrames
Low Spread account is also Highly Recommended
YOU WANT TO MAKE THE BEST TRADES POSSIBLE. FORTUNATELY, THERE IS NO BETTER WAY TO TRADE FOREX THAN USING A FOREX EA. THAT’S BECAUSE THEY HAVE ALL THE TOOLS YOU NEED FOR THE MOST EFFECTIVE STRATEGY POSSIBLE.

FEATURES
DOWNLOAD THE FOREX ROBOTS THAT MADE OVER $1,000,000 IN PROFIT
Automated System
Opens, manages, and closes the best trades for you. No need to lift a finger.
Great Trading Strategy
Plots chart price in real time to find the best entry and exit points with no lag.
Fully Optimized Settings
Comes loaded with optimized settings for over 20 common forex pairs.
Real Time Broker Shield™
Keeps shady brokers from trading against you by guarding your trade information.
Most Popular Forex Robot
The #1 choice of professional forex traders using expert advisors.
Simple To Setup And Use
Designed for any skill level. Get up and running in less than 5 minutes.
LIVE PERFORMANCE FXBLUE
LIVE PERFORMANCE MYFXBOOK

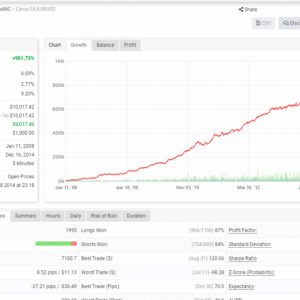
REAL ACCOUNT BACKTEST REPORT – 12 YR REAL ACCOUNT BACKTEST
SPECIAL FEATURES
Number One Robot for Forex & Crypto Trading.
Based on Price Action and Trend Analysis with Artificial Intelligence.
Works Best with EURUSD, XAUUSD, GBPUSD, BTCUSD, BTCJPY.
You can use this EA on Multiple Accounts with Life Time Premium Support.
MyFXbook, FxBlue & Live Trading Verified.
Monthly Expected Profit is 25% to 200% with 10-20% Drawdown.
PREMIUM BUNDLE PACK
100% AUTOMATED ROBOT, 95% ACCURATE, HANDS-FREE TRADING WORKS ON MT4.


